

A database of time and location of avalanches in Făgăraș Mountains was completed, and first avalanche inventory based on GeoEye-1 images was conducted. These data are very useful for an objective evaluation of the location, magnitude and frequency of the snow avalanches in the Carpathians.
An automated detection algorithm for snow avalanches in optical images has been developed and validated using HR and VHR satellite images. The texture characteristics of the avalanche-affected snow were extracted by convolving the image with a set of 12 multi-scale multi-directional filters.
The algorithm has correctly identified many of the avalanches in the test areas (up to 87% from the total number of avalanches). Detection errors were generated by the variability in terrain and snow characteristics. To compensate these effects, is possible to increase the number of filters.
The algorithm has been tested on VHR satellite images with 40-60 cm spatial resolution (QuickBird, WorldView-1 and GeoEye-1).
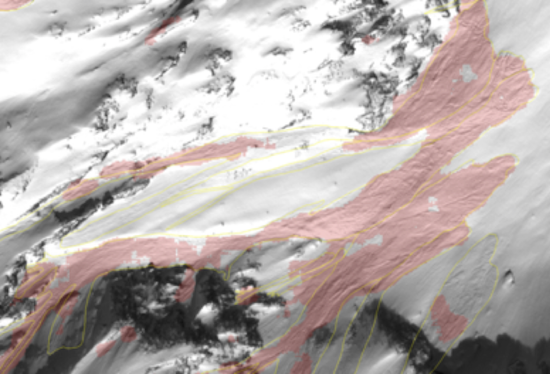
Detailed GeoEye-1 image with snow avalanches in Făgăraș area. Yellow oulines represent avalanches manually digitized and the red areas represent the avalanches detected by the algorithm.
Methodology and stages of development have been established for the change-detection algorithm in avalanche affected areas. The proposed algorithm is also based on multi-date SAR images. The underlying principle is a pixel-wise comparison of the backscatter intensities of two SAR images, an event image and a reference image, and assumes that both the event image and the reference image are acquired in the same beam mode, pass direction and from the same repeat cycle. The satellite images were selected from archive and corrections have been made.
The avalanche detection algorithm was tested on several Sentinel-1 and Radarsat-2 images in mountain areas from Norway. The performance metric of the results indicates that the algorithm does not agree completely with the manual identifications.
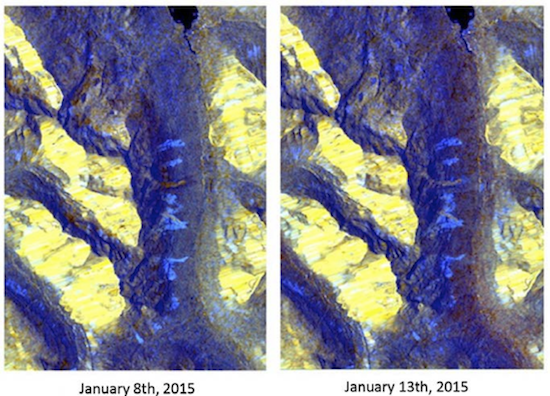
Avalanche deposits identified in Sentinel-1 images from January 2015 (Avalanches are represented by blue blobs, results indicate small differences between images)
Snow avalanche simulation has been tested and calibrated using RAMMS software. DEMs at various spatial resolutions have been used with different global and snow friction parameter settings.
Calculation and classification of friction parameters is based on DEM derived data (altitudine, slope, curvature), forest cover and global parameters (volume and return period). For the estimation of the return period of avalanches in the test areas, data from dendrochronologic reconstructions from other studies have been used. Trajectories simulation have been tested on several high impact past avalanches identified in statistics. The avalanche trajectories, depth, velocity, pressure and spatial extent of the snow deposits were simulated for the glacier valley of Bâlea. The results were similar with the data found in the events descriptions. This activity will continue and avalanche hazard maps will be generated for the test areas.
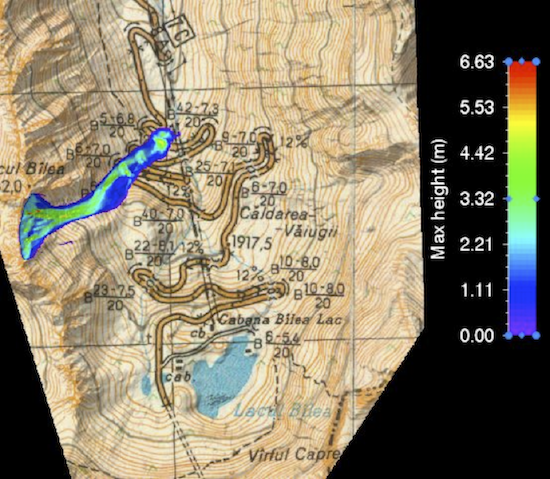
Avalanche trajectory and snow depth simulation for the avalanche in Bâlea, Aprilie 1974
It was elaborated the methodology, in order to obtain the updated land use/land cover map of the Romanian study area. The methodology consists in:
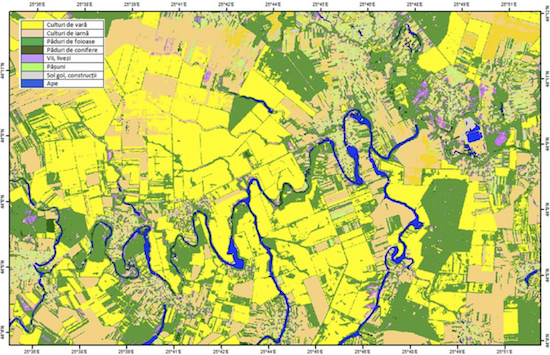
Land cover/land use map for the study area – unsupervized classification (Landsat 8 OLI) subset
Accessing and comparing of recent information relating to land cover / land use lead in updating and improving the quality of existing databases. Within a GIS system, through integration with orthophotos and / or satellite images can be achieved a better management and monitoring of agricultural and non-agricultural land in a territory.
The methodology for data assimilation of snowpack parameters in the hydrologic model NWSRFS and in the system for estimation of flash floods occurrence risk in Romania – ROFFG, was designed. The optimal values of the snow water equivalent resulted after the application of the data fusion procedure will be assimilated in a specific way, for adjusting the state parameters.
An important aspect that was taken into consideration is related to the fact that at the time when the water equivalent value simulated by the SNOW-17 model is changed, in an automatic way it is also changed accordingly within the NWSRFS systems the percent of snow cover at the hydrographic basin level.
The inventory and selection process was done for the software systems, modules and utilities that are needed for implementing the methodology of snowpack parameters assimilation in the operational hydrological forecasting models.
Using the selected software applications was started the implementation of scripts and programs for handling the export-import operations for the data flow, and for the specific processing steps for assimilating the snowpack parameters into the operational hydrological models NWSRFS and ROFFG.
The assessment of the existing infiltration methods based on energetic equilibrium and on the temperature index revealed the advantages and disadvantages of both methods. The models based on the temperature index are easy to apply and have reasonable results, bur sensitive to weather conditions, especially wind speed and solar radiation. In order to improve these methods and to raise the accuracy of the results it recommended using the parameters concerning the wind and the humidity. The energetic equilibrium models are sensitive to data input estimation errors (wind, solar radiation and albedo). Thus, a better parameterization of the albedo factor, the wind function and a better estimation of the meteorological conditions could increase the accuracy of the results. In-situ measurements were performed to determine the infiltration from snowmelt. Based on these measurements a mathematical simulation model for water flow into the unsaturated zone was developed.
Three representative study areas were chosen for the project. For each of them the geological, hydrogeological and climatic settings were described in detailed. The three study areas are: 1. Bolboci – Vf. Omu, 2. Prahova-Teleajen Aluvial Cone and 3. Colentina Site (Bucharest City).
The aquifer recharge process was considered for each of the hydro structures: fissured mountain aquifer and the las type of aquifer, represented by the Colentina Site. The predictions of water infiltration trough frozen soils can be used to assess the risks and damages caused by climate chance especially in mountain region and regions with permafrost.
The analyses of changes in snow depth, snow amount and melted snow amount was completed during October-April, in Romania, under the RCP 4.5 and RCP 8.5 scenarios for the timeframes 2021-2050 and 2070-2099. The reference interval considered is 1971-2000. In the analyses the results of numerical experiments were used, with five regional climate models from the EURO-CORDEX program. Under more intense radiative forcing (RCP 8.5 scenario) the decrease of the snow depth, the amount of snow, and the increase of the amount of melted snow in mountainous areas are higher in the analysed intervals. These changes will become stronger at the end of the XXI century, especially under the RCP 8.5 scenario.
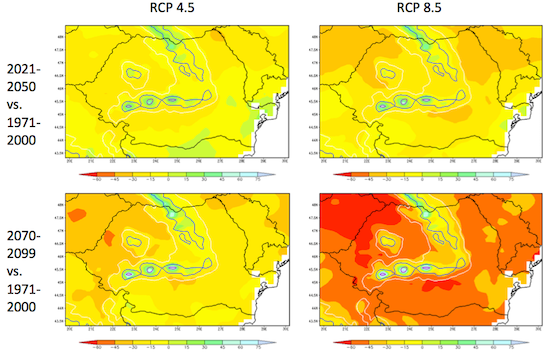
Changes in the ensemble of mean snow melt amount (in %) in the interval from October to April under the RCP 4.5 and RCP 8.5 scenarios for the periods 2021-2050 and 2070-2099 as compared to the reference period 1971-2000
A hydrological model calibration was performed by simulating the snow accumulation and melting processes in the upper part of the Arges and Ialomita river basins. To simulate the flow in the upper part of the Argeş and Ialomiţa river basins the conceptual hydrological model Consul was used, model developed within the I.N.H.G.A. The main rainfall-runoff processes considered by the hydrological model are: accumulation and melting of the snow cover, precipitation interception, water storing in depressions, evapotranspiration, infiltration, percolation, surface runoff, hypodermic runoff and basic runoff.
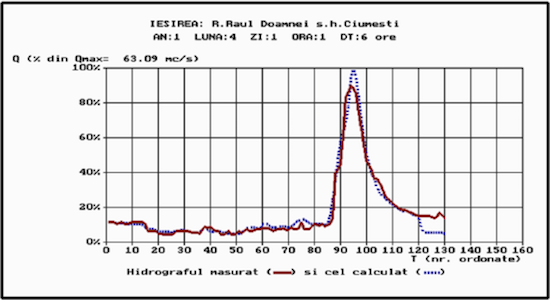
Observed (–––) and simulated (-----) discharge hydrographs at the hydrometric station Ciumești on the river Râul Doamnei in April 2001
The previous analyses have continued in order to develop the empirical model that links the atmospheric circulation characteristics to avalanches indices. Thus, a list with the dates of avalanches was drawn up, starting from 1928 to the present. Related information are also available for these events which have taken place in the Ceahlău, Făgăraş, Bucegi, Lotru, Rodna, Retezat, Piatra Craiului, Căpăţânii, Gutîi, Postăvaru, Ţarcu, Vâlcan, and Baiului mountains. The most frequent avalanches are recorded in the Făgăraş and Bucegi mountains.
This work represents the single-sensor algorithm development and validation in the test sites in Norway and Romania for the 2015 season. The validation was limited to comparison with air temperature as this was what was available for the 2015 season, but will be extended with comparison with in-situ snow liquid water measurements when these become available for the 2016 season.
Optical snow wetness based on MODIS from 15 May 2015 acquired at 11:35 UTC for Norway and from 14 February 2015 acquired at 09:25 UTC for Romania
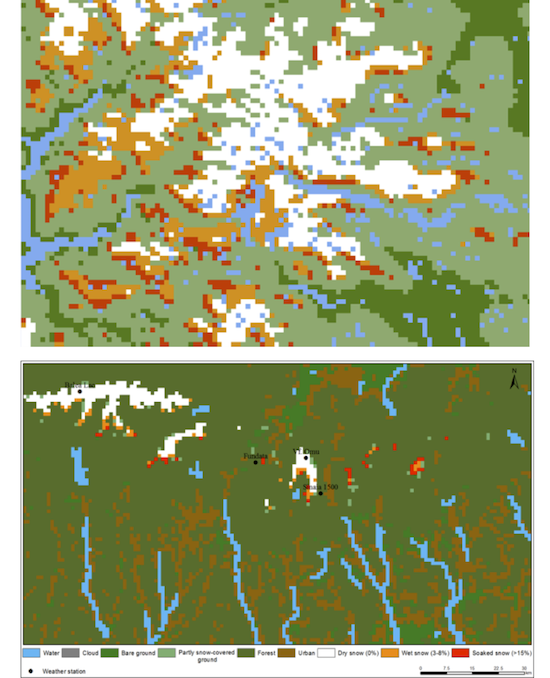
The multi-sensor/multi-temporal wet snow (MWS) algorithm have been developed by fusing optical and SAR data to map the wet snow area. Multi-temporal observations of wet snow with optical and SAR are fused in a novel model simulating states of surface properties to generate reliable wet snow maps. The algorithm is based on NR’s experience of combining data from multiple sensors using 4Hidden Markov Model (HMM) approaches. The snow map includes the thematic classes dry snow, moist snow, wet snow, very wet snow and soaked snow, in addition to partial snow cover, bare ground and clouds.
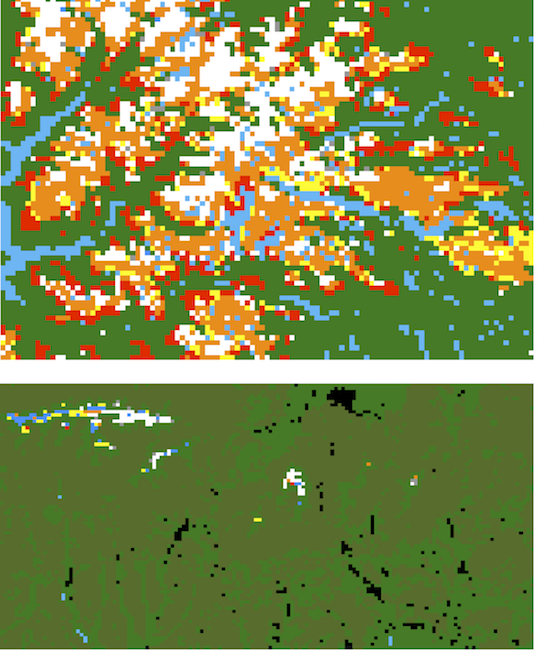
Multi-sensor snow wetness map from Jutunheimen, Norway, 21 April 2015 and Romania, 23 April 2015.
The validation analysis of the retrieval results for snow wetness from the novel multi-sensor/multi-temporal approached seems very promising, delivering retrieval results on a daily basis as categorical degrees of snow wetness independent of cloud cover. The approach is, however, mainly data driven so lack of observations necessarily also gives lack of quality. But when both Sentinel-1A and -1B become available (in the autumn 2016 according to ESA’s schedule), the observations become rather dense as Sentinel-3 also will give daily optical observations (but limited by cloud cover).
During this phase, was designed the methodology for estimating the snow water equivalent, by data fusion approach, using the distributed model NOAH simulations, ground observations and satellite products. Within the methodology, the different type of data and information are analyzed and compared, using a series of automatic cross-validation algorithms, and then the snow water equivalent is estimated in grid format, at spatial resolution of 1 km, by multiple successive steps of interpolations and adjustments, depending on the degree of uncertainty associated with different type of data.
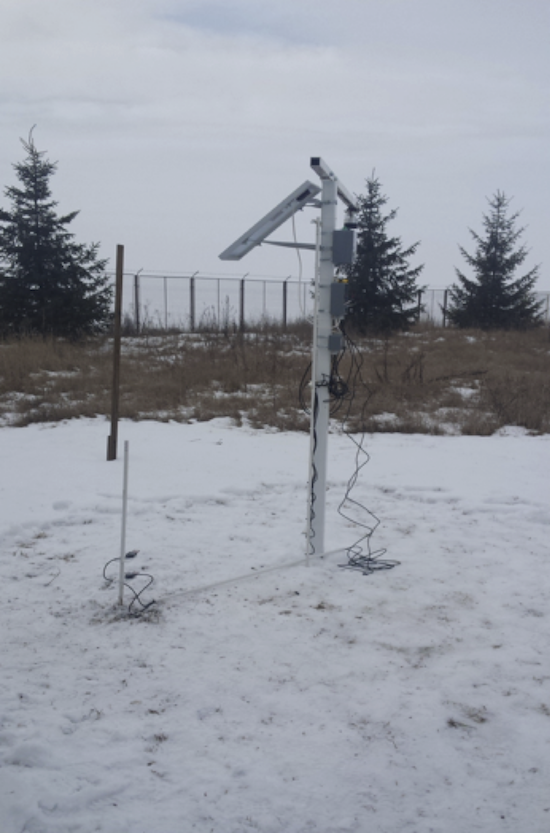
The cal/val site in Tg. Secuiesc – station T1 (snow depth, snow profile temperature and snow wetness)
Both NMA and NR have made measurements of the snow spectra, using the FieldSpec Pro (ASD Inc.) and respectively the DSR (StellarNet) portable spectrometers. During the winter season 2016-2017, the spectral measurements of the snow pack will resume at the same locations and the data gathered will be used for the calibration/validation of the snowpack properties retrieval algorithms in the optical domain.
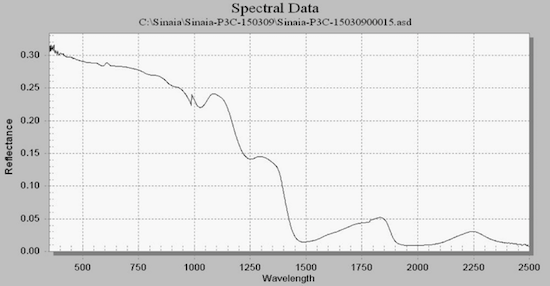
Solar Spectrum (vertical) measured with FieldSpec Pro – Sinaia, March 2015
The following tasks were carried out during the geospatial database design and implementation:
Data and databases originating from the following sources have been used to populate the geospatial database: government institutions, freely available data (internet based), national projects, and data from the SnowBall consortium members –either existing or produced for the project needs (topographical map, orthophotomap, satellite imagery vectorisation or GPS data collection).
Daily gridded data sets have been produced at a spatial resolution of 1000 x 1000 m for the period 1st October 2005 – 30 April 2015 for the following parameters: air temperature (minima, average and maximum), precipitations, snow depth (SD) and snow water equivalent (SWE).